Blog

SEC Rules Linking Exec Pay and Stock Price Miss the Mark

On April 29, 2015 the SEC released a Fact Sheet regarding “rules that would provide greater transparency and better inform shareholders.”  http://www.sec.gov/news/pressrelease/2015-78.html. The proposed rules would require companies to disclose executive pay and stock performance information for itself and companies in a peer group. This proposal places emphasis entirely on the wrong results and is an example of needless regulation.

Corporate executives should be judged on improvements in the underlying drivers of the business that they control. They should not be judged based on a stock price they don’t control.

Stock price movement often has nothing to do with management. Why should corporate executives be judged by stock price movements (up or down) that are unrelated to their actions?  Particularly in the short term, stock prices are influenced by industry activity, interest rates, and the trend of the overall market among other things. For example, a competitor being acquired often raises a company’s stock price.  Actavis (ACT) announced the acquisition of Forest Labs on February 18, 2014. In the next 3 days (in a slightly down market) Teva Pharmaceuticals stock rose 6.3%. Is Teva’s stock price move attributable to anything management did? No.  So why would an investor use that to judge the appropriateness of executive compensation?

Executives should be judged on how they impact the business.  Growth in revenues, earnings per share, and cash flow are all important.  Capital allocation is critical. Returns on invested capital and return on equity capital are important indicators of value creation.  Corporate executives should have their eye on factors like these, not the gyrations of their stock price.  Investors would be well served to do the same.

Can shareholder oriented executive compensation packages incentivize managers to influence fundamentals in a constructive way and improve the value of the company? Yes! But sometimes industry or market factors might cause a company with terrible executive comp policies to also do well.  The proposed rules do nothing to help investors distinguish one from the other. Evaluating the effectiveness of executive comp is difficult because executive comp does not always drive stock performance. The SEC is proposing a short-cut to this process that misses the point. The free market understands this and will pay little attention to the information the SEC is requiring to be compiled.  The cost of companies complying with this requirement will certainly outweigh the benefit to investors and be a drag (albeit modest) on investor returns.

One Question for Messrs Buffett and Munger

Tomorrow, Saturday May 2nd, 2015, Warren Buffett and Charlie Munger will hold court over a crowd of 40k+. As they do every year, they will spend several hours answering questions about the current and future workings of Berkshire Hathaway. Three journalists and three investment analysts will ask the questions.

If we were given the opportunity to ask a question, we would focus on Berkshire Hathaway Energy -BHE – (formerly MidAmerican Energy) and the threat to traditional utility businesses from distributed generation (DG).

During 2014, BHE provided 9% of Berkshire’s revenue and 11% of pre-tax operating earnings. In the most recent annual letter, Mr. Buffett refers to BHE as one of the “Powerhouse Five” collection of Berkshire’s largest non-insurance businesses. He goes on to write, “a century hence, BNSF and Berkshire Hathaway Energy will still be playing vital roles in our economy.” Later, he adds that BHE has “recession-resistant earnings, which result from these companies offering an essential service on an exclusive basis.”

Their conviction is very high. We wonder if both Messrs Buffett and Munger are underestimating the potential threat from distributed generation (i.e. power generated at the individual household level using solar technology). Is it possible that the developments in Hawaii described in detail in a recent NYTimes article are just the beginning?

BHE has invested $15B in renewable energy generation capabilities and is the largest generator of renewable energy in the US. In addition BHE’s largest subsidiaries are in geographies with no immediate threat (the ratio of sunlight to traditional generation fuel cost is favorable). Yet, solar is not a typical fuel source. It is a technology that behaves according to Moore’s Law – every year it is twice as efficient and half the price as the previous year.

So, if we had the floor for a minute in Omaha tomorrow, here is what we would ask: “Messrs Buffet and Munger, what if technology made it so BHE was no longer the exclusive provider of power in its covered geographies? Doesn’t solar offer the possibility that the distribution component of the regulated utility industry shrinks significantly in size? BHE uses solar as a fuel source, but that alone can’t neutralize the threat. Solar has the potential to be much more than a substitute for coal or gas in the old utility regime. Centralized power generation isn’t necessarily ideal. In the past it was just the only practical option. Today, decentralized power generation is just as practical in a few locations (e.g. Hawaii), but it is becoming so in more and more geographies by the year. The efficiency of solar is increasing and the cost decreasing at a rate commensurate with Moore’s Law – and it should, as solar panels are similar in structure to computer chips. As this trend continues, individual solar power generation will become practical in more and more locations. And so, how can you be so confident in BHE’s ability to earn a “good” return long into the future? Is it possible that solar may be to the utility industry what the internet was to the newspaper business?”

We remain long $BRK, confident in the overall business mix, the broad diversification, and the “moat” that accrues from the structure Mr. Buffett has developed over the last 50 years. We are also optimistic that BHE managers can adjust the business to new realities over time. Still, we would like to hear some additional details on how they think about the distributed generation threat.

Long $BRK.

eBay: Secular Growth In a Low-Growth World

The overall economic environment has been and remains weak. Real GDP’s four-year CAGR from 2010-2013 is only 2.25%. Retail sales are weak too – growing 2.4% in Q1. Yet, ecommerce remains strong – growing 15% in Q1. Even in a stagnant economy there are secular growers. EBAY’s key metrics are growing even faster than ecommerce. Off-EBAY PayPal usage is accelerating. Merchant Services Total Payment Volume grew 33% y/y in Q2 2014. EBAY’s shares have been flat for six quarters, but intrinsic value continues to grow.

[et_pb_section bb_built=”1″][et_pb_row][et_pb_column type=”4_4″][et_pb_text _builder_version=”3.15″]

While the overall economy’s slow growth presents an investment headwind, there are still opportunities. Of course, sales growth is not a prerequisite for investment success. Plenty of people have gotten rich buying depleting assets like oil wells. Price paid is always the determining factor. But, secular1 growth has its merits, particularly in a world where growth is scarce. A growing company with a competitive business advantage can reinvest capital at a high rate. Owners can compound their return rather than continually look for the next place to put the proceeds of their royalty stream (to use the oil well analogy again).

Two of the most powerful secular growth trends today are the shift from offline retail to e-commerce and the shift from physical currency to cashless transactions. eBay (EBAY) is well positioned to take advantage of both of these trends.

The first half of this year was full of noise and distractions for EBAY: publicly-hostile correspondence with activist investor Carl Icahn (who did make some good points), a security breach that forced a system-wide password reset, and a new algorithm from Google that had a detrimental impact on search results for eBay listings. Despite these challenges, EBAY grew Enabled Commerce Volume (ECV) 26% year-over-year in the second quarter. This is up from 20% in the first quarter of 2013. And, it is significantly better than the already strong growth in ecommerce. The US Census Bureau estimates ecommerce grew 15% in the first quarter compared to 2.4% for all retail sales.2

While EBAY’s company-wide trends are strong, PayPal’s trends are even stronger. Every single metric is solid, but we are particularly excited to see Merchant Services Total Payment Volume growing at an accelerated rate – from 26% year-over-year in the first quarter of 2013 to 33% in the second quarter of 2014. This tells us that PayPal is NOT just being used within eBay’s Marketplaces. More and more, it is being used across ecommerce (and even offline) to facilitate payments.
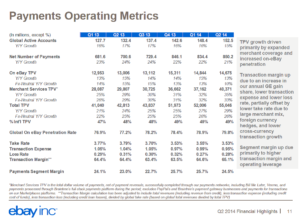
Figure 2 – EBAY’s payment metrics slide from the Q2 2014 earnings call shows strong growth in merchant services TPV.

We first discussed our eBay position in our third quarter 2013 letter. At the time of that letter, EBAY shares traded just above $50. We wrote, “We initially purchased eBay shares in December 2011. At the time, eBay was unloved trading at 18x 2011 earnings per share and just 12x 2012’s prospective earnings. Since then, eBay’s shares have returned over 75%, but that return was all in 2012. Shares have been flat throughout 2013.” It is now nine months later and we can say shares were flat for all of 2013, as well as the first two quarters of 2014. In other words, our EBAY investment has not produced results for six quarters. However, intrinsic value has grown significantly. This is the more important metric for the long-term investor.

While the economy is growing at low-single digit rates, EBAY’s industry (ecommerce) is growing in the mid-teens, and EBAY’s participation in this industry (its ECV) is growing in the mid-20s. Yet, EBAY trades at the same multiple as the S&P 500. With the S&P 500 at all-time highs and growth scarce, there are few bargains. We think EBAY is one.

This article is an excerpt from our Q2 2014 quarterly letter.

1 A trend that is neither cyclical nor seasonal but long-term in nature.

2 Click here

Disclosure: At the time of publication, GOCM was long EBAY. The information contained herein should not be construed as personalized investment advice. Past performance is no guarantee of future results. There is no guarantee that the views and opinions expressed in this newsletter will come to pass. Investing in the stock market involves the potential for gains and the risk of losses and may not be suitable for all investors. Information presented herein is subject to change without notice and should not be considered as a solicitation to buy or sell any security. Any information prepared by any unaffiliated third party, whether linked to this newsletter or incorporated herein, is included for informational purposes only, and no representation is made as to the accuracy, timeliness, suitability, completeness, or relevance of that information. The stocks we elect to highlight will not always be the highest performing stocks in the portfolio, but rather will have had some reported news or event of significance or are either new purchases or significant holdings (relative to position size) for which we choose to discuss our investment tactics. They do not necessarily represent all of the securities purchased, sold or recommended by the adviser, and the reader should not assume that investments in the securities identified and discussed were or will be profitable. A complete list of recommendations by Grey Owl Capital Management, LLC may be obtained by contacting the adviser at 1-888-473-9695.

[/et_pb_text][/et_pb_column][/et_pb_row][/et_pb_section]

Why Margin Debt Matters

Margin debt is not a useful tool for market timing, but it does help to describe the general stability of the financial system.

(This article first appeared on Seeking Alpha on Jan 31, 2014.)

For the past few months, cautious investors, perma-bears, or reasonable skeptics (depending on your point of view) have emphasized the rise of margin debt balances to historic highs as one more sign that “all the passengers are on one side of the boat.” In a January 27 post, Zero Hedge’s “Tyler Durden” wrote, “margin debt rose by another $21 billion in December to an all time high of $445 billion, and up 29% from a year ago.” He goes on to explain how grossly understated this number is given hedge funds’ ability to borrow beyond traditional margin limits. Dr. John Hussman of the eponymous Hussman Funds wrote of surging margin debt at least as far back as April, 2013. Even the more staid Wall Street Journal has published warnings about the rise in margin debt. For example, the October 24, 2013 Morning MarketBeat was titled Risky Business of Rising Margin Debt.

Yet, in a December 20, 2013 commentary, technical analysis service Lowry Research Corporation points out that “since market tops are always a reflection of excessive risk-taking, it is reasonable to expect margin debt to be at high levels near major market tops. But, that does not mean it is an effective or accurate tool for anticipating major market tops. History shows that margin debt was at record levels for each of 19 years, from 1950 to 1969 and for each of 25 years, from 1976 to 2000.”

So, does margin debt matter? We believe the answer is yes. While it may not be a useful tool for market timing, it does help to describe the general stability of the financial system – particularly when viewing margin debt expressed as a percentage of a normalizing variable such as gross domestic product (GDP). The greater the margin debt as a percentage of the system, the less stable the system is.

Why is margin debt destabilizing? There are several reasons:

  1. Margin debt is a loan that can be called at any time. Imagine how precarious the housing market would be if your bank could call you on Monday morning and tell you to pay off your mortgage by the middle of the week or they would start selling the windows and doors on your home.
  2. The higher margin debt becomes as a percentage of financial assets, the smaller the selloff in financial assets needed to cause the margin clerk to make the above-described call. Traditional margin loans are governed by Regulation T. This allows investors to borrow against 50% of their capital initially. Therefore, an investor with $100 could make a $200 investment. Importantly, the investor must maintain at least a 25% capital ratio. So, if that $200 investment went down more than 33%, the margin clerk is calling. Unfortunately, this oversimplifies the issue. Institutional investors can use far more leverage and the margin call is governed by more than just Regulation T’s maintenance requirement. If a large brokerage firm gets nervous and wants to take down their loan balance, they can make a margin call. If they don’t like the type of collateral being held (maybe momentum stocks like AMZN, or NFLX, or YELP) they can make a margin call. To use the home analogy again, it would be as if your bank could require you to repay your mortgage if they were worried a hurricane was headed towards your neighborhood.
  3. When margin debt is high enough, selling begets selling. It could work like this. a) Some broker-dealer(s) get over-extended by lending against a class of securities that proves to have much more downside volatile than they originally expected. As these assets selloff, the firm(s) begin to call in margin loans. b) The portfolio managers getting the margin call sell securities into a falling market in order to pay off their loans. c) The additional selling causes the market to go down more. d) Go back to a) until such time as the system is unlevered and securities are primarily owned without debt.

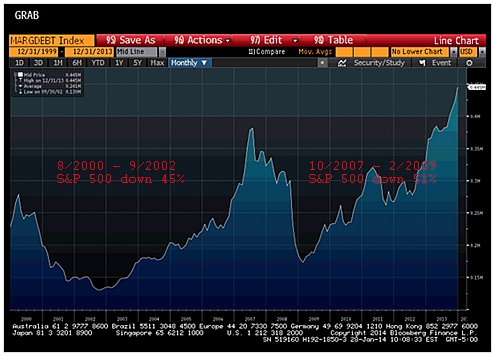
Thus, while neither absolute margin debt levels nor margin debt as a percent of GDP may be good market timing indicators, significant margin debt IS emphatically a sign that the system is unstable. We submit the following chart of the two most recent margin debt peaks as evidence.

margindebt

This graph, created using Bloomberg Financial, shows the absolute dollar amount of margin debt from the end of 1999 through the end of 2013. At the margin debt trough in September 2002, the S&P 500 had fallen 45% from its August 2000 level. At the margin debt trough in February 2009 the S&P 500 had fallen 51% from its October 2007 level.

The information contained herein should not be construed as personalized investment advice.  Past performance is no guarantee of future results.  There is no guarantee that the views and opinions expressed in this blog will come to pass.  Investing in the stock market involves the potential for gains and the risk of losses and may not be suitable for all investors.  Information presented herein is subject to change without notice and should not be considered as a solicitation to buy or sell any security.

A complete list of recommendations by Grey Owl Capital Management, LLC may be obtained by contacting the adviser at 1-888-473-9695.

Will World Wrestling Entertainment Pin NBC?

(This was originally published on Seeking Alpha on Jan 13, 2014.)

At this week’s Consumer Electronics Show, World Wrestling Entertainment (WWE) announced the launch of WWE Network. Covering the event, The Wall Street Journal wrote, “World Wrestling Entertainment Inc. is sidestepping the cable world that long has been its bread and butter to launch the WWE Network, a subscription-only, online video channel that will air round-the-clock programming.”

While a terrific opportunity for significant value creation, it is unlikely this is a complete “sidestep” of cable. Rather, WWE is flexing its collective muscle as it continues to renegotiate its two largest broadcast rights agreements with NBC Universal. The contracts for “Raw” and “Smackdown” expire this year and NBC Universal’s exclusive negotiation period concludes at the end of this month. The timing of the network announcement seems aimed at pushing NBC Universal toward action. It was as if they said, in the words of the late Randy “Macho Man” Savage, “Hey NBC, snap into a Slim Jim!

We typically invest in high-return businesses, with strong competitive advantages, and executives with a record of excellent capital allocation and balance sheet management. We aim to hold these types of investments for at least 3-5 years and in the best case, forever. We discussed our five largest positions, all of which meet these criteria, in our third quarter 2013 letter.

WWE does not exactly fit these parameters. Yet, we are owners of WWE equity. It is our belief that the current “Raw” and “Smackdown” distribution agreements are so far below market that there is a high probability they will renew at 2, 3, or even 4x the current rate. The majority of this new revenue should flow to the bottom line. Thus, we were willing to overlook their shareholder-unfriendly dual share class structure, an operating history that includes questionable capital allocation decisions, and a dividend that is not covered by current cash flow. The immediacy and magnitude of the event present an incredible risk reward dynamic.

We have followed the evolution of the media business for some time, compelled by the increasing value of content in general and “DVR-proof” content (typically live sports) specifically. Additionally, we find the ongoing shift in media consumption patterns brought on by the proliferation of broadband Internet access intriguing. We watched from the sidelines for several years. Then, we came across a Forbes video and story highlighting the pending WWE broadcasting deal negotiations. We immediately recognized the investment opportunity.

The analysis is relatively straightforward:

  1. WWE content is approximately as valuable as “live sports” content. While WWE events are not “live sports” they have attributes that make them equally “DVR-proof.” Nielson estimates that 95% of the TV audience for sports watches live. Live viewership for WWE events is in the low 90%s.
  2. Given current market rates, WWE should be able to increase their rights fees by 2-4x. WWE’s current deals are both several years old and were below market from the beginning. If WWE is able to renegotiate their cost per viewer hour to match the low-end of current sports rights deals (Fox’s NASCAR deal) their rights fees would more than double. At the high-end (NBC’s NHL deal), their rights fees would increase more than 13x. 2-4x is a conservative estimate.
  3. A market-rate rights deal for “RAW” and “Smackdown” would translate to significantly higher EBITDA and a much more valuable business franchise. A doubling of the rights fees would add close to $85mm to EBITDA. A quadrupling would add close to $255mm. At three times the current contract, we get a back-of-the-envelope fair value around $25 / share. This is almost 50% upside from today’s price of $17.
  4. The catalyst is imminent. With NBC Universal’s exclusive period about to expire, we believe a new deal could be announced in the next few months.

Oh, by the way, the WWE Network could have some value too.

Long WWE.

The information contained herein should not be construed as personalized investment advice.  Past performance is no guarantee of future results.  There is no guarantee that the views and opinions expressed in this blog will come to pass.  Investing in the stock market involves the potential for gains and the risk of losses and may not be suitable for all investors.  Information presented herein is subject to change without notice and should not be considered as a solicitation to buy or sell any security.

A complete list of recommendations by Grey Owl Capital Management, LLC may be obtained by contacting the adviser at 1-888-473-9695.

Three thoughts on the JPMorgan (JPM) trading fiasco

1. Black box finance. In our latest letter, we described how financials led the market for the first quarter and yet, we reminded clients that we don’t own any depository financials.  We wrote:

“As we hinted in our first page introduction, we are not particularly bullish on depository financials (i.e. banks).  The community banks have too much capacity, significantly limiting growth.  The large ‘money-center’ banks are subject to vast new legislation by the name of Dodd-Frank that we believe will significantly reduce their returns relative to historical trends.  In addition, the big banks are essentially black boxes.  They may trade below stated book value, but does anyone, including the CEOs and CFOs of these immensely complex institutions with their myriad derivative positions, really know what book value is?

If yesterday’s revelation by JPMorgan CEO Jamie Dimon regarding unforeseen trading losses in their risk management group is not enough empirical evidence to close the case on our point, we don’t know what is.

With highly levered banks, the black box could include positions that completely wipe out equity holders.  This thinking on “money-center” banks is not new – we’ve continually emphasized it in both written and oral communications with clients for several years.  All investors need to cope with uncertainty but our primary objective is to protect capital, so if there is a meaningful possibility of total loss we will pass. This framework is a hallmark of our investment process. We participate when the range of possible outcomes are all positive, or (for very small positions) when the probability weighted expected outcome is very high.  Potential returns between 6% and 12% (see Excelon), are acceptable.  Potentially being wiped out is not.

2. Jamie Dimon. Jamie Dimon remains an impressive leader.  Frank, tough, and seemingly fair, he has built a career and a bank by methodically putting one foot in front of the other, taking the long view, and (for the most part) acting conservatively.  There is a positive potential outcome of this event.  If this causes Mr. Dimon to recognize the vast gulf between a 2 trillion dollar bank’s operations and his ability to monitor and control these operations, this event will guide the direction he takes the bank.  JPMorgan would become a better institution.  In addition, there is some chance that his approach to this issue will further enhance his stature as a banker and a leader.  His frank mea culpa yesterday was a start in this direction.

3. Ben Bernanke. The primary culprit here does not receive a JPMorgan paycheck nor work in Manhattan (or London).  Rather, his check is signed by Uncle Sam and his office is at 20th & Constitution Avenue in Washington, DC.  While it is still unclear exactly what positions JPMorgan held and holds in its CIO office, financial repression a la Ben Bernanke is likely the root cause of JPMorgan’s current mess.  The “London Whale’s” trading activity was just a natural reaction by a profit seeking financial institution to zero interest rates.  Bernanke dangled the bait and the whale took it.  The Federal Reserve has stated that a primary goal of their financial repression is for investors to “step out on the risk curve” (i.e. microscopic Treasury bill yields force investors to take risk to increase their yield; moving to longer durations, corporate credits, equity, leveraged derivatives, etc.).  Like all central planners before them, this Federal Reserve ignores the law of unintended consequences at citizens’ peril.

The information contained herein should not be construed as personalized investment advice.  Past performance is no guarantee of future results.  There is no guarantee that the views and opinions expressed in this blog will come to pass.  Investing in the stock market involves the potential for gains and the risk of losses and may not be suitable for all investors.  Information presented herein is subject to change without notice and should not be considered as a solicitation to buy or sell any security.

With Power Prices at a Multi-year Low, We’re Looking at Excelon Corporation (EXC)

At a current price in the mid $38s, we think Excelon Corporation (EXC) provides investors a steadily growing 5.4% dividend yield with a “free call option” on rising power prices.

With the just completed acquisition of Constellation Energy, EXC became the largest power retailer in the United States.  At $38.50 and a dividend of $2.09, the stock trades with a 5.4% current yield.  The dividend is well covered with estimated trough 2012 earnings of $3/share (a payout ratio of 70%).

EXC is essentially two distinct businesses.  The first is a regulated utility that earns a fixed return.  The second is a merchant power generator that sells power on the open market.  EXC’s power generation is primarily nuclear.  With current power prices near multi-year lows, we expect one third of 2012’s earnings (and half of EBITDA) to come from the regulated utility side of the business.  This is a very stable, slow growth business.  The regulated utility will likely earn a 10% return on equity (set by regulators) and grow earnings at 5% a year through growing its “rate base” (i.e. property, plant, and equipment).

Absent any improvement in power prices, we would expect to earn a 6-12% annualized total return on our EXC investment.  Current market expectations for future power prices and the extent to which EXC “locks in” their future selling prices will determine where in the 6-12% range our returns fall.  If future power price expectations were to match today’s low levels, our return would be closer to 6%.  If EXC were to “lock in” their sales at today’s future price expectations (the market expects prices will be higher next year and the year after), we would earn closer to 12%.  Either way, this is a significantly better return than we expect from the S&P 500 from the current, 1400 level.  We would also expect the business to be less volatile than the overall US economy and the stock’s price level to be less volatile than the S&P 500.  EXC fits several of the “high-quality” business dynamics we described in our fourth quarter 2011 quarterly letter.  But that is not the end of the story.

Power prices are near multi-year lows primarily because natural gas prices are at multi-year lows.  Natural gas provides the majority of peak usage power in the US and thus determines domestic power prices.  When demand for power increases above a certain threshold, natural gas power plants come online and provide power.  Nuclear is one of the lowest cost sources of power and thus when power prices increase, EXC’s margins expand.

Natural gas prices are at multi-year lows because of the recent shale gas revolution.  In the mid to late 2000s, entrepreneurs and engineers discovered technology and techniques to extract significant quantities of gas from sources that were never accessible before (cost effectively).  This has led to a massive increase in natural gas supply as lessees were required to drill in order to hold leases (even if the drilling was not economical).

Commodity prices typically trade at their marginal cost of production.  Reasonable estimates of all in cash costs for natural gas are closer to $6/mmBTU than the current $2.50/mmBTU spot price.  We believe there are three primary drivers that will lead to higher natural gas prices over the next few years:

  1. As leases become established, uneconomical drilling will likely stop.
  2. When new Environmental Protection Agency (EPA) rules go into place in 2015, a large number of old coal-based power plants will become uneconomic and thus come offline.  This will increase demand for natural gas.
  3. When the economy begins to recover (albeit very slowly by our analysis), a rise in industrial production will also increase the demand for natural gas.

Increased power prices could easily lead to $5/share earnings for EXC and a stock price of $50-60/share.

Outlook:  long EXC.

The information contained herein should not be construed as personalized investment advice.  Past performance is no guarantee of future results.  There is no guarantee that the views and opinions expressed in this blog will come to pass.  Investing in the stock market involves the potential for gains and the risk of losses and may not be suitable for all investors.  Information presented herein is subject to change without notice and should not be considered as a solicitation to buy or sell any security.

A complete list of recommendations by Grey Owl Capital Management, LLC may be obtained by contacting the adviser at 1-888-473-9695.

Traditional Retail will Continue to be Damaged by E-Commerce*

I recently had a “shopping” experience that has caused me to really question the economics of big box retailers.  Like many men when it comes to shopping I am more of a hunter than a gatherer.  When I need something I find my prey, I hunt it down and metaphorically kill it.  I do not spend any time looking around for other bargains or do much comparison shopping.  Until now.

With the advent of the internet, comparison shopping that once took hours can now be accomplished in minutes, from the comfort of your home or office.  My recent experience involved the purchase of a cordless phone system for my home.  Specifically we needed a two-line cordless phone system that would support multiple handsets.  I found myself at Staples for another reason, and the phone display in the store triggered me to recall our need and take a look.  A sales associate quickly approached me and asked about my needs.  Of the two options I was considering he gave his opinion and helped me make my choice.  In the process I was thinking I should check on Amazon to see what the price differential was, but I decided to buy first and then check.  In this day and age how much different could it be?  Everyone on the planet is aware of online commerce, right? Retailers have their own online capabilities, and are certainly aware of the price competition.  I decided that if it was $10-15 difference the convenience of the store would be worth it.  I also had 14 days to return the items.  Boy was I wrong.

The items I purchased from Staples for $230 ended up costing me $168 on Amazon.  Part of the difference was taxes, most of it was price.  As an Amazon Prime member shipping was free, so you might add some small shipping cost to compare apples-to- apples.  No matter how you slice it the difference is dramatic.  My cost was $62 less on Amazon for the identical items.  Put another way, the cost at Staples was 37% higher than Amazon.  No contest.  The items were returned to Staples before noon the next day.

The full impact of the shift to e-commerce has not yet been felt.  As time goes on, the first place people will look for items will be the internet, rather than as an alternative.  Granted, the online experience is not appropriate for all types of purchases.  If you are uncertain about size or fit, returning items can add to the cost and be a hassle.  But ultimately the lower cost will erode the already thin profit margins of big retailers.  Big box retailers will require less floor space and possibly fewer locations.  Retail real estate will need to adapt.  Investors need to consider this with every potential purchase.

*This discussion should not be construed as a recommendation to buy or sell Staples or Amazon.

Core Money Market Fund Change

November 23, 2011

Dear Client,

We recently changed your account’s core money market (i.e. “cash”) fund to a US Treasury money market (symbol FDUXX).[1] Our reason for doing so is rooted in safety and prudence but also in the belief that when we do take risk, we must be adequately compensated.

Money market funds’ exposure to short-term European debt is significant. The Wall Street Journal reported in June the largest US money market funds held roughly $1 trillion of debt issued by European banks. The low interest rate environment has squeezed money market funds’ ability to cover their management fees and expenses, encouraging them to “reach for yield.” Unfortunately, this reach for yield has not accrued to investors as evidenced by the uniform yield profiles across money market funds regardless of composition. This results in an asymmetric distribution of risk and reward for investors.

ZIRP[2] has artificially depressed interest rates and changed the economics of operating money market funds. While these instruments have never been large profit centers for the companies that offer them, they were largely self-sustained. With yields at record lows however, they have instead become a cost center as funds are unable to cover their expenses and fees. Funds are mitigating this, albeit marginally, by seeking higher returns while not passing through the incremental yield to investors. To illustrate this, below we provide information as of 10/31/11 for the Fidelity US Treasury Fund and the Fidelity Cash Reserves Fund. The latter is Fidelity’s largest money market fund.

Fund Name (Symbol) 7 Day SEC Yield (%) With Subsidy[3] 7 Day SEC Yield (%) Without Subsidy
Fidelity Cash Reserves (FDRXX) .01 -0.03
Fidelity US Treasury Fund (FDUXX) .01 -0.61

Source: Fidelity Investments

The second column shows both funds offer the same return: 0.01%. The holdings of the funds however, are different. FDUXX is invested, as of 10/31/11, entirely in US Treasury securities or repurchase agreements for those securities. FDRXX on the other hand holds a variety of non-US Treasury securities including certificates of deposit and commercial paper issued by European banks, among others. Given the current environment, we believe that US Treasury securities are “safer” than European debt, be it sovereign or corporate.[4] The question then becomes, why would FDRXX, which invests in higher yielding debt, offer the same return as FDUXX which invests entirely in US government debt? The third column shows the yield that investors would have obtained in the absence of subsidies. The lower the value, the more money the fund company has to spend in order to make investors whole.[5] By investing in higher yielding paper, FDRXX lowers the cost to the fund sponsor to preserve $1 NAV per share. This works out for the fund sponsor but not for the investor who still receives the same paltry yield the US Treasury fund offers although with higher risk.

To be clear, we are not sounding the alarm bells and calling for financial Armageddon. However, a fundamental cornerstone of our investment process is taking calculated risks that we are compensated for. This is simply not the case here, where investors are undertaking greater risk yet receiving the same return offered by a US Treasury money market.

As always, if you have any thoughts regarding the above ideas or your specific portfolio that you would like to discuss, please feel free to call us at 1-888-GREY-OWL.

Sincerely,

GREY OWL CAPITAL MANAGEMENT, LLC


[1] The symbol for the Treasury fund is FDUXX.

[2] Zero Interest Rate Policy

[3] SEC 7 Day Yield is the average income return over the previous seven days, assuming the rate stays the same for one year and that dividends are reinvested. It is the Fund’s total income net of expenses, divided by the total number of outstanding shares. This yield does not include capital gains or losses. Yield without Subsidy is the Class’s SEC 7 Day Yield without applicable waivers or reimbursements, stated as of month-end. Waivers and/or reimbursements may be discontinued any time. All yields are historical and will fluctuate.

[4] “Safer” in this context means lower credit risk. Because these funds hold very short maturity paper, there is al very little “interest rate” risk should US interest rates normalize.

[5] A negative yield would result in the fund’s NAV dipping below $1/share causing it to “break the buck.”

The Time to Prepare for Today’s Volatile Markets Was Long Ago

The S&P 500 peaked this year on May 2nd at 1371 (intraday).  The current selloff began on July 7th just slightly lower at 1356 (again, intraday).  From the close on July 7th through today’s close (August 8th), the S&P 500 (as measured by the SPDR S&P 500 ETF)(1) was down 17.20% on a total return basis to 1119.

While the media has recently been filled with stories fomenting panic (about the European debt crisis, the recent US debt-ceiling political argument, and now S&P’s lowering of the US’s credit rating) and suggesting all sorts of portfolio strategies, the time to prepare for increased volatility and lower equity prices was long ago.  These crises did not appear out of thin air and are not really crises in and of themselves.  Rather, they are symptoms of underlying issues that have been building for some time, in plain sight.  The Fed was trying to trick investors with zero percent interest rates into ignoring the problems, but eventually that had to give.

We have long been advocating portfolios built primarily around higher quality investments and reserving some cash or “dry powder” for a time when securities would likely sell at better values.  Our rationale was based on the following:

  • Broad equity market valuations were and are too high.  We discussed a basic methodology for valuing broad markets in detail in our fourth quarter 2009 letter when the S&P 500 was also in the mid-1100s.
  • Developed market sovereign debt has reached unsustainable levels relative to GDP which will likely lead to increased volatility and inflation (though deflation is a potential too).  We discussed the issues of sovereign risk in our first quarter 2010 letter.
  • The US economy has been supported by fiscal and monetary stimulus and will atrophy when the steroids are eventually removed.  Our first quarter 2011 letter tells this story in pictures.

While the last month is merely a short battle in a long war, we are pleased that our typical equity (or “risk”) account’s losses  were limited to 10.65%(2) during this period; only 62% of the S&P 500’s 17.20% loss.  An important element to increasing long-term compounded growth is to minimize drawdowns.  Our equity portfolios have behaved as designed.


1. The SPDR S&P 500 ETF (“SPY ETF”) is used for comparing performance on a relative basis. There are significant differences between the SPY ETF and our accounts, which do not invest in all or necessarily any of the securities that comprise the SPY ETF.

2.  This is an intra-month estimate reflective of one account invested in our model and is not representative of all clients. While clients were invested in the same securities, this performance does not reflect a composite return.The return presented is net of all adviser fees and includes the reinvestment of dividends and income. Clients may also incur other transactions costs such as brokerage commissions, custodial costs, and other expenses. For the most recent performance, please visit www.greyowlcapital.com or call us at 703-459-9400.

THE RETURN SHOWN REPRESENTS PAST PERFORMANCE AND IS NO GUARANTEE OF FUTURE RESULTS. NO CURRENT OR PROSPECTIVE CLIENT SHOULD ASSUME THAT FUTURE PERFORMANCE RESULTS WILL BE PROFITABLE OR EQUAL THE PERFORMANCE PRESENTED HEREIN.