One Question for Messrs Buffett and Munger

Tomorrow, Saturday May 2nd, 2015, Warren Buffett and Charlie Munger will hold court over a crowd of 40k+. As they do every year, they will spend several hours answering questions about the current and future workings of Berkshire Hathaway. Three journalists and three investment analysts will ask the questions.

If we were given the opportunity to ask a question, we would focus on Berkshire Hathaway Energy -BHE – (formerly MidAmerican Energy) and the threat to traditional utility businesses from distributed generation (DG).

During 2014, BHE provided 9% of Berkshire’s revenue and 11% of pre-tax operating earnings. In the most recent annual letter, Mr. Buffett refers to BHE as one of the “Powerhouse Five” collection of Berkshire’s largest non-insurance businesses. He goes on to write, “a century hence, BNSF and Berkshire Hathaway Energy will still be playing vital roles in our economy.” Later, he adds that BHE has “recession-resistant earnings, which result from these companies offering an essential service on an exclusive basis.”

Their conviction is very high. We wonder if both Messrs Buffett and Munger are underestimating the potential threat from distributed generation (i.e. power generated at the individual household level using solar technology). Is it possible that the developments in Hawaii described in detail in a recent NYTimes article are just the beginning?

BHE has invested $15B in renewable energy generation capabilities and is the largest generator of renewable energy in the US. In addition BHE’s largest subsidiaries are in geographies with no immediate threat (the ratio of sunlight to traditional generation fuel cost is favorable). Yet, solar is not a typical fuel source. It is a technology that behaves according to Moore’s Law – every year it is twice as efficient and half the price as the previous year.

So, if we had the floor for a minute in Omaha tomorrow, here is what we would ask: “Messrs Buffet and Munger, what if technology made it so BHE was no longer the exclusive provider of power in its covered geographies? Doesn’t solar offer the possibility that the distribution component of the regulated utility industry shrinks significantly in size? BHE uses solar as a fuel source, but that alone can’t neutralize the threat. Solar has the potential to be much more than a substitute for coal or gas in the old utility regime. Centralized power generation isn’t necessarily ideal. In the past it was just the only practical option. Today, decentralized power generation is just as practical in a few locations (e.g. Hawaii), but it is becoming so in more and more geographies by the year. The efficiency of solar is increasing and the cost decreasing at a rate commensurate with Moore’s Law – and it should, as solar panels are similar in structure to computer chips. As this trend continues, individual solar power generation will become practical in more and more locations. And so, how can you be so confident in BHE’s ability to earn a “good” return long into the future? Is it possible that solar may be to the utility industry what the internet was to the newspaper business?”

We remain long $BRK, confident in the overall business mix, the broad diversification, and the “moat” that accrues from the structure Mr. Buffett has developed over the last 50 years. We are also optimistic that BHE managers can adjust the business to new realities over time. Still, we would like to hear some additional details on how they think about the distributed generation threat.

Long $BRK.
Why Margin Debt Matters

Margin debt is not a useful tool for market timing, but it does help to describe the general stability of the financial system.

(This article first appeared on Seeking Alpha on Jan 31, 2014.)

For the past few months, cautious investors, perma-bears, or reasonable skeptics (depending on your point of view) have emphasized the rise of margin debt balances to historic highs as one more sign that “all the passengers are on one side of the boat.” In a January 27 post, Zero Hedge’s “Tyler Durden” wrote, “margin debt rose by another $21 billion in December to an all time high of $445 billion, and up 29% from a year ago.” He goes on to explain how grossly understated this number is given hedge funds’ ability to borrow beyond traditional margin limits. Dr. John Hussman of the eponymous Hussman Funds wrote of surging margin debt at least as far back as April, 2013. Even the more staid Wall Street Journal has published warnings about the rise in margin debt. For example, the October 24, 2013 Morning MarketBeat was titled Risky Business of Rising Margin Debt.

Yet, in a December 20, 2013 commentary, technical analysis service Lowry Research Corporation points out that “since market tops are always a reflection of excessive risk-taking, it is reasonable to expect margin debt to be at high levels near major market tops. But, that does not mean it is an effective or accurate tool for anticipating major market tops. History shows that margin debt was at record levels for each of 19 years, from 1950 to 1969 and for each of 25 years, from 1976 to 2000.”

So, does margin debt matter? We believe the answer is yes. While it may not be a useful tool for market timing, it does help to describe the general stability of the financial system – particularly when viewing margin debt expressed as a percentage of a normalizing variable such as gross domestic product (GDP). The greater the margin debt as a percentage of the system, the less stable the system is.

Why is margin debt destabilizing? There are several reasons:

  1. Margin debt is a loan that can be called at any time. Imagine how precarious the housing market would be if your bank could call you on Monday morning and tell you to pay off your mortgage by the middle of the week or they would start selling the windows and doors on your home.
  2. The higher margin debt becomes as a percentage of financial assets, the smaller the selloff in financial assets needed to cause the margin clerk to make the above-described call. Traditional margin loans are governed by Regulation T. This allows investors to borrow against 50% of their capital initially. Therefore, an investor with $100 could make a $200 investment. Importantly, the investor must maintain at least a 25% capital ratio. So, if that $200 investment went down more than 33%, the margin clerk is calling. Unfortunately, this oversimplifies the issue. Institutional investors can use far more leverage and the margin call is governed by more than just Regulation T’s maintenance requirement. If a large brokerage firm gets nervous and wants to take down their loan balance, they can make a margin call. If they don’t like the type of collateral being held (maybe momentum stocks like AMZN, or NFLX, or YELP) they can make a margin call. To use the home analogy again, it would be as if your bank could require you to repay your mortgage if they were worried a hurricane was headed towards your neighborhood.
  3. When margin debt is high enough, selling begets selling. It could work like this. a) Some broker-dealer(s) get over-extended by lending against a class of securities that proves to have much more downside volatile than they originally expected. As these assets selloff, the firm(s) begin to call in margin loans. b) The portfolio managers getting the margin call sell securities into a falling market in order to pay off their loans. c) The additional selling causes the market to go down more. d) Go back to a) until such time as the system is unlevered and securities are primarily owned without debt.

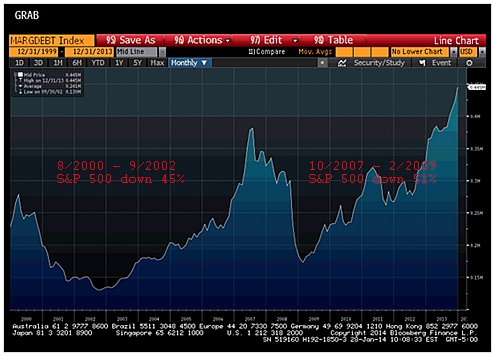
Thus, while neither absolute margin debt levels nor margin debt as a percent of GDP may be good market timing indicators, significant margin debt IS emphatically a sign that the system is unstable. We submit the following chart of the two most recent margin debt peaks as evidence.

margindebt

This graph, created using Bloomberg Financial, shows the absolute dollar amount of margin debt from the end of 1999 through the end of 2013. At the margin debt trough in September 2002, the S&P 500 had fallen 45% from its August 2000 level. At the margin debt trough in February 2009 the S&P 500 had fallen 51% from its October 2007 level.

The information contained herein should not be construed as personalized investment advice.  Past performance is no guarantee of future results.  There is no guarantee that the views and opinions expressed in this blog will come to pass.  Investing in the stock market involves the potential for gains and the risk of losses and may not be suitable for all investors.  Information presented herein is subject to change without notice and should not be considered as a solicitation to buy or sell any security.

A complete list of recommendations by Grey Owl Capital Management, LLC may be obtained by contacting the adviser at 1-888-473-9695.

With Power Prices at a Multi-year Low, We’re Looking at Excelon Corporation (EXC)

At a current price in the mid $38s, we think Excelon Corporation (EXC) provides investors a steadily growing 5.4% dividend yield with a “free call option” on rising power prices.

With the just completed acquisition of Constellation Energy, EXC became the largest power retailer in the United States.  At $38.50 and a dividend of $2.09, the stock trades with a 5.4% current yield.  The dividend is well covered with estimated trough 2012 earnings of $3/share (a payout ratio of 70%).

EXC is essentially two distinct businesses.  The first is a regulated utility that earns a fixed return.  The second is a merchant power generator that sells power on the open market.  EXC’s power generation is primarily nuclear.  With current power prices near multi-year lows, we expect one third of 2012’s earnings (and half of EBITDA) to come from the regulated utility side of the business.  This is a very stable, slow growth business.  The regulated utility will likely earn a 10% return on equity (set by regulators) and grow earnings at 5% a year through growing its “rate base” (i.e. property, plant, and equipment).

Absent any improvement in power prices, we would expect to earn a 6-12% annualized total return on our EXC investment.  Current market expectations for future power prices and the extent to which EXC “locks in” their future selling prices will determine where in the 6-12% range our returns fall.  If future power price expectations were to match today’s low levels, our return would be closer to 6%.  If EXC were to “lock in” their sales at today’s future price expectations (the market expects prices will be higher next year and the year after), we would earn closer to 12%.  Either way, this is a significantly better return than we expect from the S&P 500 from the current, 1400 level.  We would also expect the business to be less volatile than the overall US economy and the stock’s price level to be less volatile than the S&P 500.  EXC fits several of the “high-quality” business dynamics we described in our fourth quarter 2011 quarterly letter.  But that is not the end of the story.

Power prices are near multi-year lows primarily because natural gas prices are at multi-year lows.  Natural gas provides the majority of peak usage power in the US and thus determines domestic power prices.  When demand for power increases above a certain threshold, natural gas power plants come online and provide power.  Nuclear is one of the lowest cost sources of power and thus when power prices increase, EXC’s margins expand.

Natural gas prices are at multi-year lows because of the recent shale gas revolution.  In the mid to late 2000s, entrepreneurs and engineers discovered technology and techniques to extract significant quantities of gas from sources that were never accessible before (cost effectively).  This has led to a massive increase in natural gas supply as lessees were required to drill in order to hold leases (even if the drilling was not economical).

Commodity prices typically trade at their marginal cost of production.  Reasonable estimates of all in cash costs for natural gas are closer to $6/mmBTU than the current $2.50/mmBTU spot price.  We believe there are three primary drivers that will lead to higher natural gas prices over the next few years:

  1. As leases become established, uneconomical drilling will likely stop.
  2. When new Environmental Protection Agency (EPA) rules go into place in 2015, a large number of old coal-based power plants will become uneconomic and thus come offline.  This will increase demand for natural gas.
  3. When the economy begins to recover (albeit very slowly by our analysis), a rise in industrial production will also increase the demand for natural gas.

Increased power prices could easily lead to $5/share earnings for EXC and a stock price of $50-60/share.

Outlook:  long EXC.

The information contained herein should not be construed as personalized investment advice.  Past performance is no guarantee of future results.  There is no guarantee that the views and opinions expressed in this blog will come to pass.  Investing in the stock market involves the potential for gains and the risk of losses and may not be suitable for all investors.  Information presented herein is subject to change without notice and should not be considered as a solicitation to buy or sell any security.

A complete list of recommendations by Grey Owl Capital Management, LLC may be obtained by contacting the adviser at 1-888-473-9695.

Core Money Market Fund Change

November 23, 2011

Dear Client,

We recently changed your account’s core money market (i.e. “cash”) fund to a US Treasury money market (symbol FDUXX).[1] Our reason for doing so is rooted in safety and prudence but also in the belief that when we do take risk, we must be adequately compensated.

Money market funds’ exposure to short-term European debt is significant. The Wall Street Journal reported in June the largest US money market funds held roughly $1 trillion of debt issued by European banks. The low interest rate environment has squeezed money market funds’ ability to cover their management fees and expenses, encouraging them to “reach for yield.” Unfortunately, this reach for yield has not accrued to investors as evidenced by the uniform yield profiles across money market funds regardless of composition. This results in an asymmetric distribution of risk and reward for investors.

ZIRP[2] has artificially depressed interest rates and changed the economics of operating money market funds. While these instruments have never been large profit centers for the companies that offer them, they were largely self-sustained. With yields at record lows however, they have instead become a cost center as funds are unable to cover their expenses and fees. Funds are mitigating this, albeit marginally, by seeking higher returns while not passing through the incremental yield to investors. To illustrate this, below we provide information as of 10/31/11 for the Fidelity US Treasury Fund and the Fidelity Cash Reserves Fund. The latter is Fidelity’s largest money market fund.

Fund Name (Symbol) 7 Day SEC Yield (%) With Subsidy[3] 7 Day SEC Yield (%) Without Subsidy
Fidelity Cash Reserves (FDRXX) .01 -0.03
Fidelity US Treasury Fund (FDUXX) .01 -0.61

Source: Fidelity Investments

The second column shows both funds offer the same return: 0.01%. The holdings of the funds however, are different. FDUXX is invested, as of 10/31/11, entirely in US Treasury securities or repurchase agreements for those securities. FDRXX on the other hand holds a variety of non-US Treasury securities including certificates of deposit and commercial paper issued by European banks, among others. Given the current environment, we believe that US Treasury securities are “safer” than European debt, be it sovereign or corporate.[4] The question then becomes, why would FDRXX, which invests in higher yielding debt, offer the same return as FDUXX which invests entirely in US government debt? The third column shows the yield that investors would have obtained in the absence of subsidies. The lower the value, the more money the fund company has to spend in order to make investors whole.[5] By investing in higher yielding paper, FDRXX lowers the cost to the fund sponsor to preserve $1 NAV per share. This works out for the fund sponsor but not for the investor who still receives the same paltry yield the US Treasury fund offers although with higher risk.

To be clear, we are not sounding the alarm bells and calling for financial Armageddon. However, a fundamental cornerstone of our investment process is taking calculated risks that we are compensated for. This is simply not the case here, where investors are undertaking greater risk yet receiving the same return offered by a US Treasury money market.

As always, if you have any thoughts regarding the above ideas or your specific portfolio that you would like to discuss, please feel free to call us at 1-888-GREY-OWL.

Sincerely,

GREY OWL CAPITAL MANAGEMENT, LLC


[1] The symbol for the Treasury fund is FDUXX.

[2] Zero Interest Rate Policy

[3] SEC 7 Day Yield is the average income return over the previous seven days, assuming the rate stays the same for one year and that dividends are reinvested. It is the Fund’s total income net of expenses, divided by the total number of outstanding shares. This yield does not include capital gains or losses. Yield without Subsidy is the Class’s SEC 7 Day Yield without applicable waivers or reimbursements, stated as of month-end. Waivers and/or reimbursements may be discontinued any time. All yields are historical and will fluctuate.

[4] “Safer” in this context means lower credit risk. Because these funds hold very short maturity paper, there is al very little “interest rate” risk should US interest rates normalize.

[5] A negative yield would result in the fund’s NAV dipping below $1/share causing it to “break the buck.”

The Time to Prepare for Today’s Volatile Markets Was Long Ago

The S&P 500 peaked this year on May 2nd at 1371 (intraday).  The current selloff began on July 7th just slightly lower at 1356 (again, intraday).  From the close on July 7th through today’s close (August 8th), the S&P 500 (as measured by the SPDR S&P 500 ETF)(1) was down 17.20% on a total return basis to 1119.

While the media has recently been filled with stories fomenting panic (about the European debt crisis, the recent US debt-ceiling political argument, and now S&P’s lowering of the US’s credit rating) and suggesting all sorts of portfolio strategies, the time to prepare for increased volatility and lower equity prices was long ago.  These crises did not appear out of thin air and are not really crises in and of themselves.  Rather, they are symptoms of underlying issues that have been building for some time, in plain sight.  The Fed was trying to trick investors with zero percent interest rates into ignoring the problems, but eventually that had to give.

We have long been advocating portfolios built primarily around higher quality investments and reserving some cash or “dry powder” for a time when securities would likely sell at better values.  Our rationale was based on the following:

  • Broad equity market valuations were and are too high.  We discussed a basic methodology for valuing broad markets in detail in our fourth quarter 2009 letter when the S&P 500 was also in the mid-1100s.
  • Developed market sovereign debt has reached unsustainable levels relative to GDP which will likely lead to increased volatility and inflation (though deflation is a potential too).  We discussed the issues of sovereign risk in our first quarter 2010 letter.
  • The US economy has been supported by fiscal and monetary stimulus and will atrophy when the steroids are eventually removed.  Our first quarter 2011 letter tells this story in pictures.

While the last month is merely a short battle in a long war, we are pleased that our typical equity (or “risk”) account’s losses  were limited to 10.65%(2) during this period; only 62% of the S&P 500’s 17.20% loss.  An important element to increasing long-term compounded growth is to minimize drawdowns.  Our equity portfolios have behaved as designed.


1. The SPDR S&P 500 ETF (“SPY ETF”) is used for comparing performance on a relative basis. There are significant differences between the SPY ETF and our accounts, which do not invest in all or necessarily any of the securities that comprise the SPY ETF.

2.  This is an intra-month estimate reflective of one account invested in our model and is not representative of all clients. While clients were invested in the same securities, this performance does not reflect a composite return.The return presented is net of all adviser fees and includes the reinvestment of dividends and income. Clients may also incur other transactions costs such as brokerage commissions, custodial costs, and other expenses. For the most recent performance, please visit www.greyowlcapital.com or call us at 703-459-9400.

THE RETURN SHOWN REPRESENTS PAST PERFORMANCE AND IS NO GUARANTEE OF FUTURE RESULTS. NO CURRENT OR PROSPECTIVE CLIENT SHOULD ASSUME THAT FUTURE PERFORMANCE RESULTS WILL BE PROFITABLE OR EQUAL THE PERFORMANCE PRESENTED HEREIN.

Claims of the “Death of Stock Picking” Are a Good Sign for Value Investors

A recent Wall Street Journal article highlights the macro-driven nature of today’s stock market.  In it, long-time value investors lament the current environment where stocks appear to trade in unison based on unemployment data or European bank stress test results.  If stocks are driven by macro factors instead of individual company fundamentals, stock pickers can’t get an edge.  Market strategist James Bianco of Bianco Research asserts “stock picking is a dead art form.”  Macro hedge-funds are opening at a rate equivalent to that of traditional stock funds and the big asset management firms are even launching macro mutual funds.

We think stock-picking is very much alive.  In fact, we recently wrote a 20-page investment guide that details a bottom-up approach for today’s environment.  Call us contrarian, but we couldn’t think of a better sign than this article that fundamentally-driven, bottom-up stock-picking is likely to make a comeback sooner rather than later.  Didn’t the commodity bubble burst right around the time that the asset management firms were rolling out a new commodity fund or ETF every week?  Moreover, didn’t “the death of equities” cover stories in the early 1980s signal the start of a 20+ year bull market for stocks?

The Wall Street Journal article presents data that shows the correlation of stocks in the S&P 500 between 2000 and 2006 was 27% – quite a bit of disparity indicating undervalued stocks could appreciate and overvalued stocks could depreciate as opposed to trading up or down in unison.  The article also points out that correlation spiked to 80% during the credit crisis and again more recently during the European sovereign debt scare.  As these issues petered out, correlations never dipped below 40% and today hover around the mid 60s.  However, the article does not point out the length of time over which the correlations were measured – days, weeks, months?

The time period over which the correlation is measured is critical.  “Time arbitrage” has proven to be a very effective investment strategy.  Who cares if individual stocks are correlated over days and weeks when your investment horizon is years?  Glenn Tongue (one of the Ts in T2 Partners along with Whitney Tilson) highlights this fact in a recent appearance on Yahoo! Finance.  Like us, the partners at T2 believe buy-and-hold stock picking is far from dead.  Mr. Tongue also makes a critical point about matching the duration of the investment strategy and the investors.  This is why we work very hard to ensure our investors understand our process before they become clients.

Don’t misunderstand our view.  We agree the data shows a significant increase in correlation between individual stocks (and we witness this as we watch the market and our individual names on a daily basis).  We also agree that the macro backdrop driving the market will remain for some time.  The over-leveraged PIIGS, US federal and local governments, and the US consumer will likely take years to adjust to sustainable levels.  In addition, the massive government intervention in fiscal and monetary policy does not appear to be subsiding with Bernanke and company preparing for QE2’s maiden cruise.  (We have discussed these issues at length in several of our recent quarterly letters.)  The market will certainly react to macro factors over short time periods, but that doesn’t mean significantly undervalued stocks or significantly overvalued stocks won’t gravitate toward fair value over a longer period of time.

In our recently published investment guide titled How to Prosper in Volatile and Range-Bound Markets we detail the strategy we are employing to deal with the current environment.  We believe a concentrated portfolio will be more likely to outperform – a few deeply discounted names that are returning capital to investors (via share repurchases or dividends) and that also have a catalyst can outperform even if the majority of the market moves in unison.  In addition, the flexibility of corporations to deal with macro shocks (be they slower growth, inflation, government regulation) means equities have a better chance of outperforming government bonds, currencies, or commodities (areas macro funds are more likely to play in).  Finally, we think valuation-based timing will be more important than it has been for traditional stock pickers.  While Japan’s macro-driven market now trades at close to a quarter of its peak value 20 years ago the market experienced four rallies and five sell-offs of greater than 30% over that period.  That type of volatility creates terrific opportunities for value investors to increase exposure as the macro shock of the day creates fear and to pare exposure as the fear fades away.

For a more detailed overview of our approach, you can download our full 20-page investment guide here:  www.greyowlcapital.com

On Buffett’s Berkshire Primer

This past Saturday, Warren Buffett released Berkshire Hathaway’s 2009 annual report and his annual letter to Berkshire shareholders.*  The last Friday in February has become like Christmas Eve for value investors the world over.  A night of tossing and turning is followed by a mad rush to the computer to download the latest version at 8am on Saturday morning.  And then, maybe 30 minutes later, melancholy as we all realize that Mr. Buffett won’t write to us again for 365 days.  As admirers of Mr. Buffett, frequent shareholders, and practitioners of the “value” approach to investing, you could count us among the sleep deprived on February 27th.

Given Berkshire’s recent (and massive) acquisition of Burlington Northern Santa Fe, Mr. Buffett chose to make this year’s letter a primer on the various Berkshire business lines, as well as his value-oriented approach to investing.  Here are a few thoughts on areas we found particularly interesting:

  • Berkshire’s stated book value was $84,487 / share (page 3).  Investments totaled $59,034mm with a cost basis of $34,646.  If one were to mark these investment to market and then subtract 20% for capital gains taxes (estimate of federal and state), Berkshire’s book value is just over $97,000 / share.  As of the close on March 2, 2010, the stock traded at $121,740 or 1.26x “adjusted” book value.
  • Mr. Buffett has always shunned excessive leverage and talked about its many risks.  He often admits that during good times the company’s equity might underperform more leveraged entities.  “Sleeping well at night” is the reason he usually provides for this strategy.  True enough, but 2008 demonstrated that over a full cycle, low leverage entities such as Berkshire can outperform because they are able to provide liquidity precisely when no one else can and in doing so receive outsized compensation.  As he writes on page 4 of the letter, “When the financial system went into cardiac arrest in September 2008, Berkshire was a supplier of liquidity and capital to the system, not a supplicant.  At the very peak of the crisis, we poured $15.5 billion into a business world that could otherwise look only to the federal government for help.”
  • The 17th century philosopher Frederic Bastiat spoke of “what is seen and what is not seen” in regards to the unintended consequences of laws on the economic sphere.  Mr. Buffett recognizes similar risks in over handed management and thus promotes an organizational approach at Berkshire that is as laissez-faire as the political approach recommended by Bastiat.  On page 5, Mr. Buffett states, “We would rather suffer the visible costs of a few bad decisions than incur the many invisible costs that come from decisions made too slowly – or not at all – because of a stifling bureaucracy.”
  • In the Insurance section beginning on page 6, Mr. Buffett states the two critical aspects of the insurance business:  1) fairly unique in business, insurance operates on a “collect-now, pay-later model” and thus requires “negative” working capital – called “float” and  2) because enough people have recognized how favorable these economics are, the insurance industry as a whole operates at an underwriting loss.  Berkshire offers shareholders a unique proposition:  the firm has demonstrated an ability to invest the “float” in a very profitable way AND because of the superior managers and compensation structure the Berkshire insurance companies operate under, the firm has consistently operated at an underwriting profit.
  • In the Utilities section, which begins on page 8, Mr. Buffett provides insight into why Berkshire is now willing to own such capital-intensive business when in the past they avoided them.  Two explanations are given:  1) today, Berkshire is so big that Mr. Buffett has no choice but to look at opportunities he would have passed on before and 2) given the regulated nature of utilities, Mr. Buffett seems to believe that he is trading some investment upside for greater certainty.  This makes sense to us.  Other investors and financial writers (including Whitney Tilson) have articulated a third possibility:  because Berkshire pays a “negative” rate on its borrowings (i.e. “float”) investments that would be unprofitable for others can be profitable for them.
  • The housing market makes its way into the letter on page 12 in the Finance and Financial Products section.  Given the lowest-in-fifty-years 2009 housing start number, Mr. Buffett believes that “within a year or so residential housing problems should largely be behind us.”  While he is correct in stating that 2009’s 554k starts is well below the 1.2mm annual housing formation number, we think his optimism might be a bit premature.  The recession has probably lowered the annual housing formation number and published inventory numbers are too low when bank “real estate owned” is considered.
  • Mr. Buffett then discusses the structural problems at Clayton Homes that are a result of the government’s housing finance policy.  The government artificially lowers the interest rate for conventional mortgages.  Therefore, when financing is considered, a traditional home can be cheaper than the manufactured houses sold by Clayton.  Mr. Buffett doesn’t say this but this is another example of Bastiat’s “not seen.”  It also reminds us that in the current climate, government interference must be a part of the investment calculus.
  • Berkshire is unlikely to experience the damaging impact of “group think.”  In describing Berkshire’s derivative contracts, Mr. Buffett (on pages 15 and 16) assures shareholders that these contracts neither expose Berkshire to extreme leverage nor to counterparty risk.  “If Berkshire ever gets in trouble, it will be my fault.  It will not be because of misjudgments made by a Risk Committee or Chief Risk Officer.”
  • Mr. Buffett concludes the financial section with a well-deserved excoriation of financial company CEOs and directors.  However, regarding his defense of investors against the “bail-out” claim, we offer one final quibble with Mr. Buffett.  He states, “Collectively, they [shareholders of the largest financial institutions] have lost more than $500 billion in just the four largest financial fiascos of the last two years.  To say these owners have been “bailed-out” is to make a mockery of the term.”  If he is using the term “owners” very explicitly, then, with the exception of Bear Stearns shareholders, perhaps he is correct.  However, he leaves out the fact that bond holders of these same insolvent institutions, who knowingly assumed the risk of capital loss, were in fact bailed out to the tune of hundreds of billions of dollars and made whole by taxpayers.

That wraps up the highlights as we see them.  However, the whole letter is well worth reading and it is available here:  http://www.berkshirehathaway.com/letters/2009ltr.pdf

*This discussion should not be construed as a recommendation to buy or sell Berkshire Hathaway.

Greenlight’s Einhorn Allows Us to Learn from His Mistakes

David Einhorn is a value investor with an excellent track record and a willingness to take controversial stands against powerful interests (that have frequently proven correct).  He is also willing to engage in public critique of his own investment process, which allows us all to learn vicariously from his mistakes.  He recently presented at the Value Investing Congress and made the following very relevant points.

  1. Regarding specific investments where he ignored the macro-picture (i.e. the housing bubble).  “The lesson that I have learned is that it isn’t reasonable to be agnostic about the big picture.”  Einhorn goes on to say that this does not mean that individual security selection is irrelevant, but rather that an investment process that combines top-down and bottom-up analysis is best.
  2. On why politicians are continuing to kick the can down the road regarding the nation’s fiscal imbalance.  Two basic problems with our government: a) the need to get re-elected (or stay appointed) makes politicians short-term oriented and b) special interests drive the agenda because the benefits of their initiatives are concentrated and the costs are spread out so much that no individual feels too much pain.
  3. On the right approach to the economic crisis and an alternative theory for the 1938 double-dip recession.  Einhorn points out that GDP grew 17% in 1934, 11.1% in 1935, and 14.3% in 1936, yet the current powers that be warn that removing stimulus too soon caused a double-dip recession in 1938.  His theory:  “An alternative lesson form the double dip the economy took in 1938 is that the GDP created by massive fiscal stimulus is artificial.”
  4. On the results of the government’s largess.  “I believe that the conventional view that government bonds should be ‘risk free’ and tied to nominal GDP is at risk of changing.  Periodically, high quality corporate bonds have traded at lower yields than sovereign debt.  That could happen again.”

The full speech is worth reading and is available here.